> ## Documentation Index
> Fetch the complete documentation index at: https://docs.clearspend.ai/llms.txt
> Use this file to discover all available pages before exploring further.
# AI spend
> Track foundation-model usage and cost across OpenAI, Anthropic, Google Gemini, and other providers.
**Work in progress.** AI Spend is available in the app but still marked **WIP** in the sidebar. Features and layout may change between releases. Not every workspace sees the nav item yet — open `/{orgId}/ai-spend` directly if your role has access.
The AI spend module brings usage and cost data from foundation-model providers into the same view as the rest of your SaaS spend.
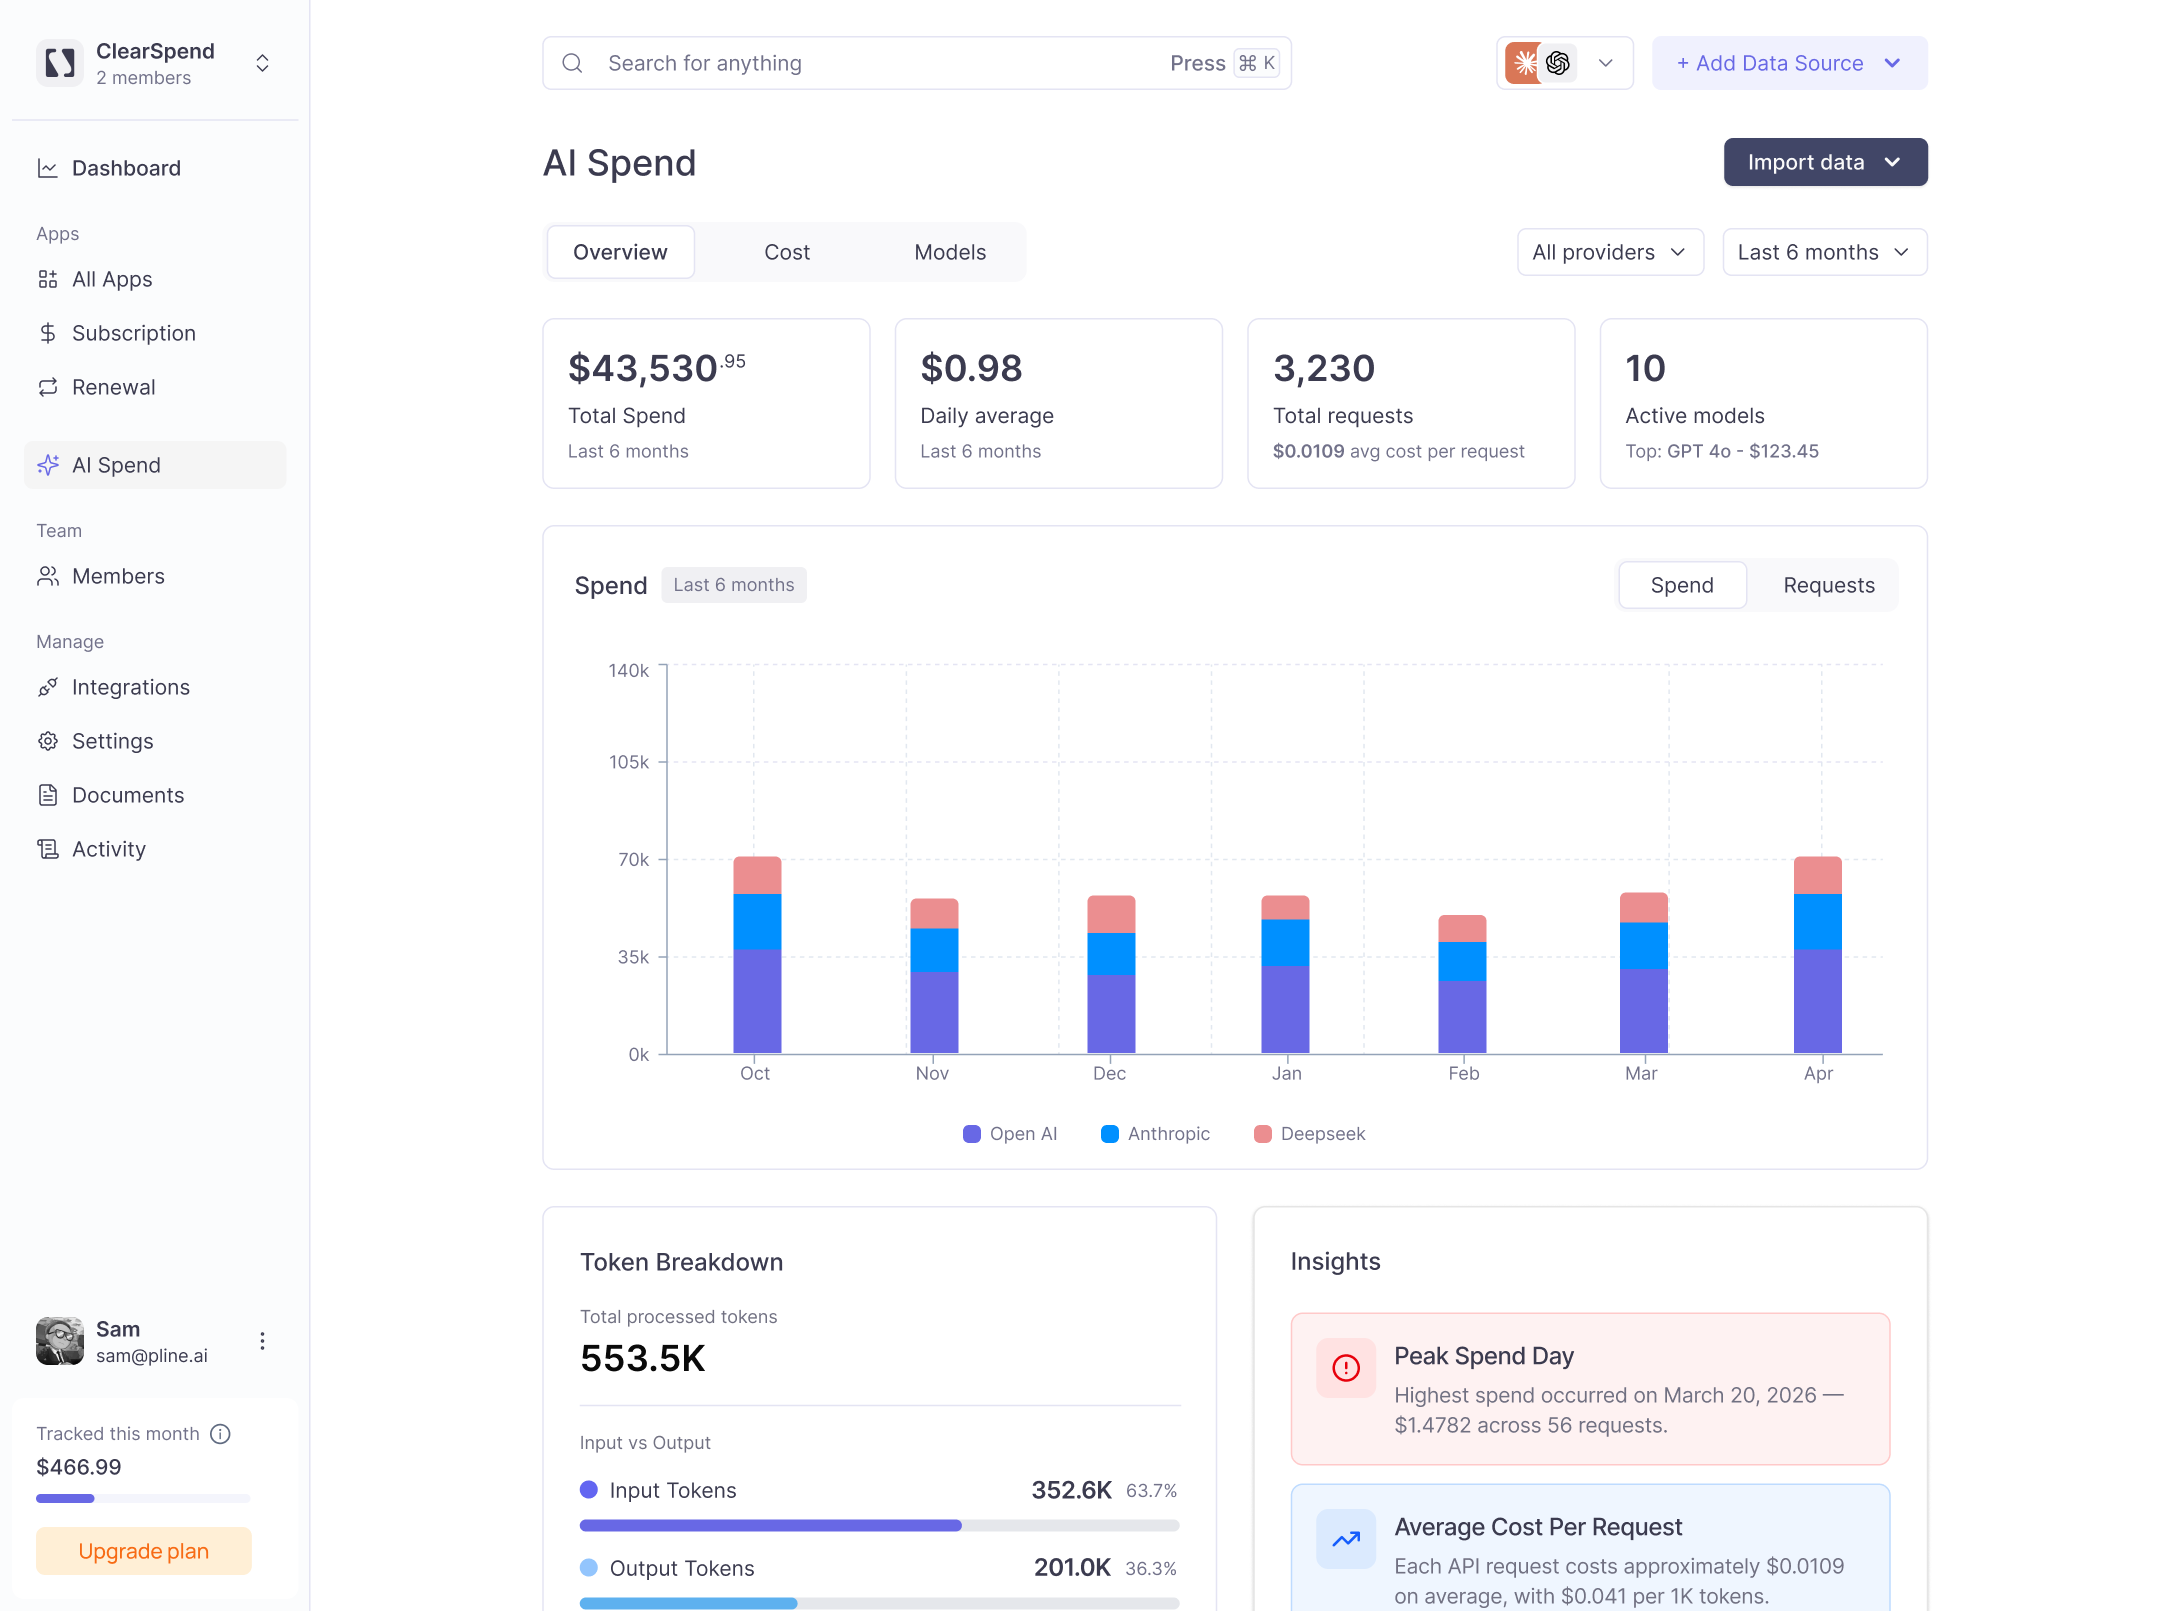 ## KPIs
Four cards anchor the top of the AI Spend page:
| KPI | What it shows |
| ------------------ | -------------------------------------------------------------- |
| **Total Spend** | Cumulative cost across all providers over the selected window. |
| **Daily average** | Mean daily cost, with average cost per request. |
| **Total requests** | Number of API calls made across all models. |
| **Active models** | Count of distinct models in use, with the top model by cost. |
## Providers
OpenAI, Anthropic, and Google Gemini are supported. Use the **All providers** filter to scope the dashboard to a single vendor. Use the date filter (e.g. Last 6 months) to adjust the time window.
## Tabs
| Tab | What it shows |
| ------------ | ---------------------------------------------------- |
| **Overview** | Total spend trend broken down by provider per month. |
| **Cost** | Per-day cost breakdown. |
| **Models** | Which specific models are driving spend. |
| **Imports** | History of CSV imports and their processing status. |
## Spend chart
The **Spend** bar chart shows monthly spend stacked by provider. Use it to see which vendors are growing month over month.
## Token breakdown
Shows total processed tokens split between **Input Tokens** and **Output Tokens**, with percentage share for each.
## Insights
Automated callouts surface key findings such as:
* **Peak Spend Day:** the single highest-cost day and how much was spent across how many requests.
* **Average Cost Per Request:** the mean cost per API call and the cost per 1K tokens.
## Importing usage
Click **Add data** in the top-right to upload a CSV export from your AI provider. ClearSpend auto-routes the file based on its schema when possible.
For providers that require column mapping, use **Manage import labels** (`/{orgId}/ai-spend/labels`) to map CSV columns to your workspace entities before import.
Most providers let you schedule a recurring CSV export. Pair that with email forwarding so AI usage flows in automatically.
## Related
* [Adding a data source](/connect/data-sources)
* [Dashboard](/features/dashboard)
## KPIs
Four cards anchor the top of the AI Spend page:
| KPI | What it shows |
| ------------------ | -------------------------------------------------------------- |
| **Total Spend** | Cumulative cost across all providers over the selected window. |
| **Daily average** | Mean daily cost, with average cost per request. |
| **Total requests** | Number of API calls made across all models. |
| **Active models** | Count of distinct models in use, with the top model by cost. |
## Providers
OpenAI, Anthropic, and Google Gemini are supported. Use the **All providers** filter to scope the dashboard to a single vendor. Use the date filter (e.g. Last 6 months) to adjust the time window.
## Tabs
| Tab | What it shows |
| ------------ | ---------------------------------------------------- |
| **Overview** | Total spend trend broken down by provider per month. |
| **Cost** | Per-day cost breakdown. |
| **Models** | Which specific models are driving spend. |
| **Imports** | History of CSV imports and their processing status. |
## Spend chart
The **Spend** bar chart shows monthly spend stacked by provider. Use it to see which vendors are growing month over month.
## Token breakdown
Shows total processed tokens split between **Input Tokens** and **Output Tokens**, with percentage share for each.
## Insights
Automated callouts surface key findings such as:
* **Peak Spend Day:** the single highest-cost day and how much was spent across how many requests.
* **Average Cost Per Request:** the mean cost per API call and the cost per 1K tokens.
## Importing usage
Click **Add data** in the top-right to upload a CSV export from your AI provider. ClearSpend auto-routes the file based on its schema when possible.
For providers that require column mapping, use **Manage import labels** (`/{orgId}/ai-spend/labels`) to map CSV columns to your workspace entities before import.
Most providers let you schedule a recurring CSV export. Pair that with email forwarding so AI usage flows in automatically.
## Related
* [Adding a data source](/connect/data-sources)
* [Dashboard](/features/dashboard)