When to use the dashboard
- Monday check-in — KPI cards and upcoming renewals widget
- Board or finance review — spending trend (Trend vs Actual vs Reconciliation)
- Customize your layout — show only the widgets you need
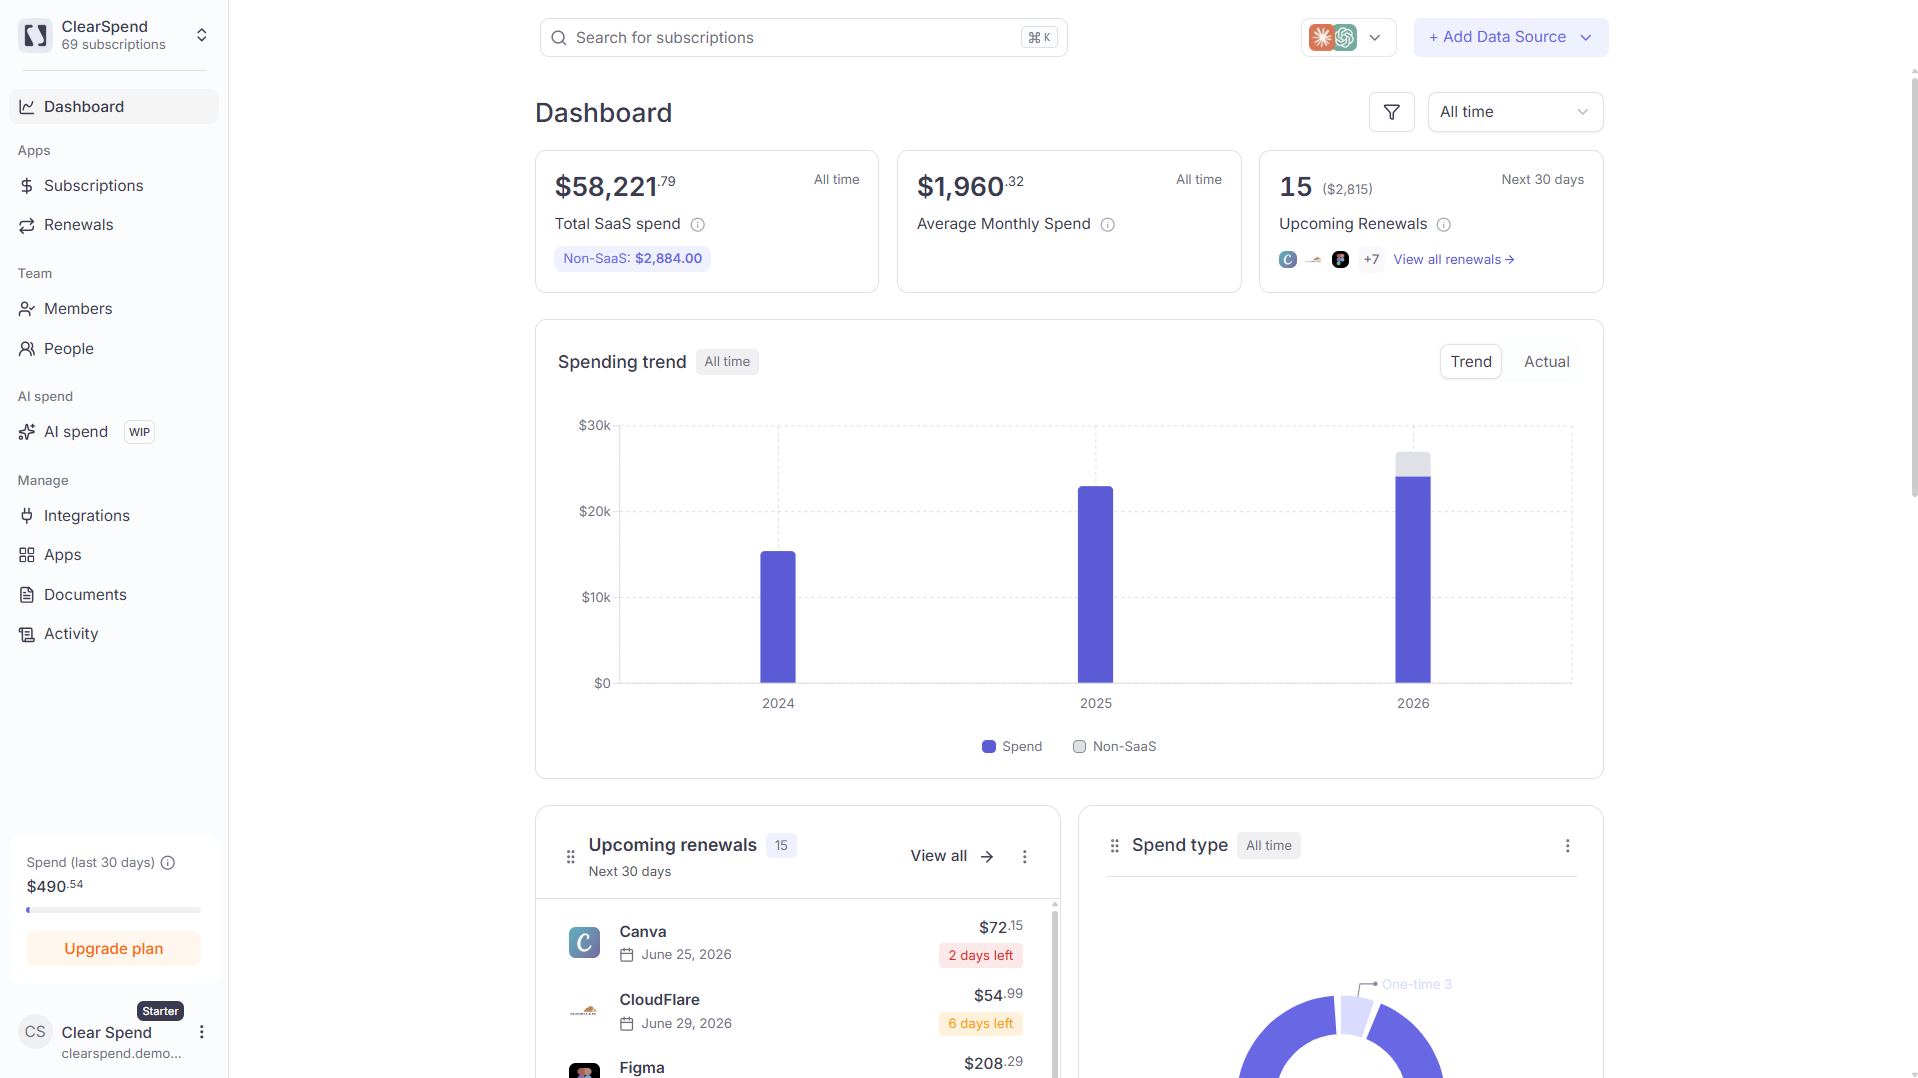
SaaS spend vs. Non-SaaS spend
ClearSpend splits every transaction into one of two buckets:| Type | What it includes | Included in KPIs and charts? |
|---|---|---|
| SaaS spend | Subscriptions with a recognized software category (Figma, AWS, Cursor, Slack, etc.). Also includes subscriptions with an empty or blank category (treated as SaaS until classified otherwise). | ✅ Yes |
| Non-SaaS spend | Any subscription categorized as “Others”: hotels, flights, hardware, and anything that isn’t software spend. | ❌ No (excluded from all KPIs, charts, and totals) |
What to do if a subscription is miscategorized
What to do if a subscription is miscategorized
If you see a subscription that should be SaaS but ended up under “Others” (or vice versa), fix it directly from the subscriptions list: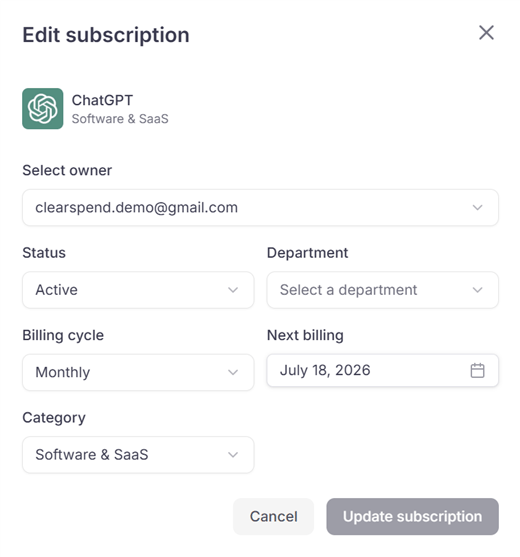
- Go to the Subscriptions page
- Find the subscription and click the ⋯ (three dots) menu on its row
- Click Edit. A pop-over appears.
- Change the Category field to the correct software category (or to Others to exclude it)
- Click Update subscription. The change takes effect immediately and the subscription’s amount will start appearing in (or disappearing from) all KPIs and charts.
Subscriptions with a blank or missing category are counted as SaaS spend by default. Only the “Others” category excludes a subscription from calculations.
Dashboard sections
KPIs
Total SaaS spend, average monthly spend, and upcoming renewals — what each card shows and what counts toward the totals.
Spending trend
Trend, Actual Spend, and Reconciliation views — how to read each mode and toggle non-SaaS spend.
Widgets
All four widgets, how to show/hide them, and how to customize your layout.
Something wrong?
| Symptom | What to do |
|---|---|
| KPIs show $0 | No data yet — Add a data source or check Activity |
| Vendor missing from totals | Category is Others — SaaS vs Non-SaaS |
| Widget missing | Open Customize charts and enable it |
Next steps
Add a data source
Upload invoices, forward statements by email, or connect an integration to start populating your dashboard.
View subscriptions
Dig into your grouped subscription list with filters, billing cycles, and spend totals.
Track renewals
See every upcoming auto-renewal and act before it hits your card.
Connect integrations
Link Google Workspace, Gmail, or Google Drive to keep your data fresh automatically.