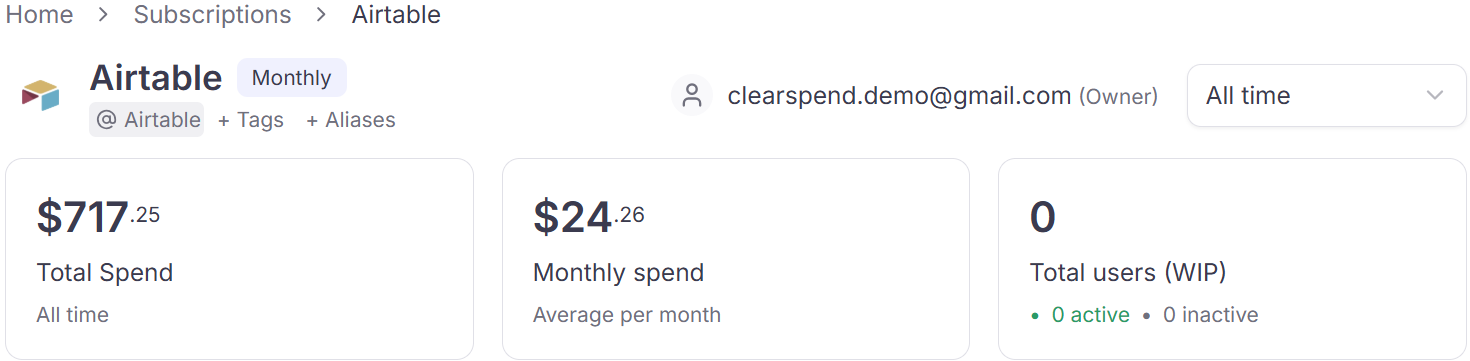
KPIs
Three summary cards at the top:| KPI | What it shows |
|---|---|
| Total spend | Cumulative spend on this subscription over the selected date window |
| Average monthly spend | Mean monthly cost, with a trend vs. the prior period |
| Total users | Number of seat-holders, broken down into active vs. inactive |
Spending trend
A line chart showing monthly spend for this subscription over time. Use this to spot price increases, usage spikes, or gaps where no charges were recorded.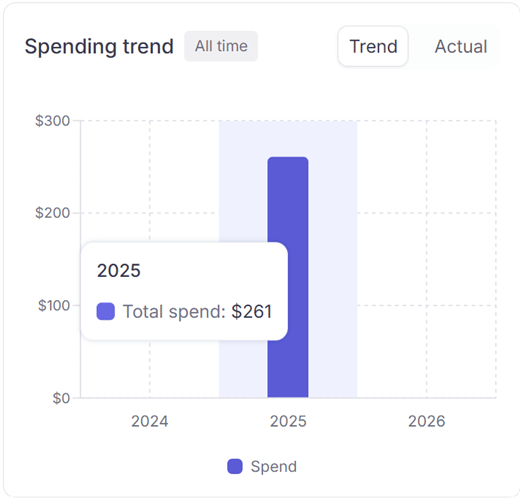
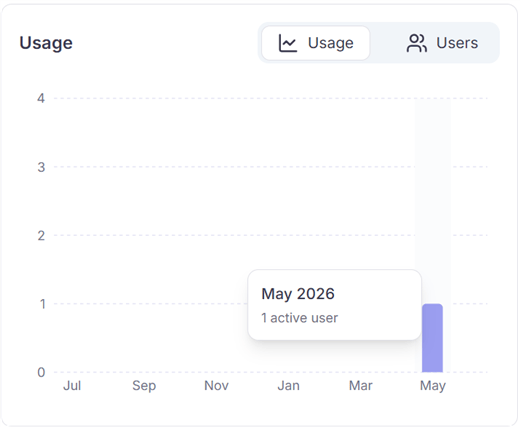
Usage
Toggle between two views:- Usage: a chart showing activity volume over time (logins, OAuth events, etc.)
- Users: a list of every person using this subscription with their last activity date
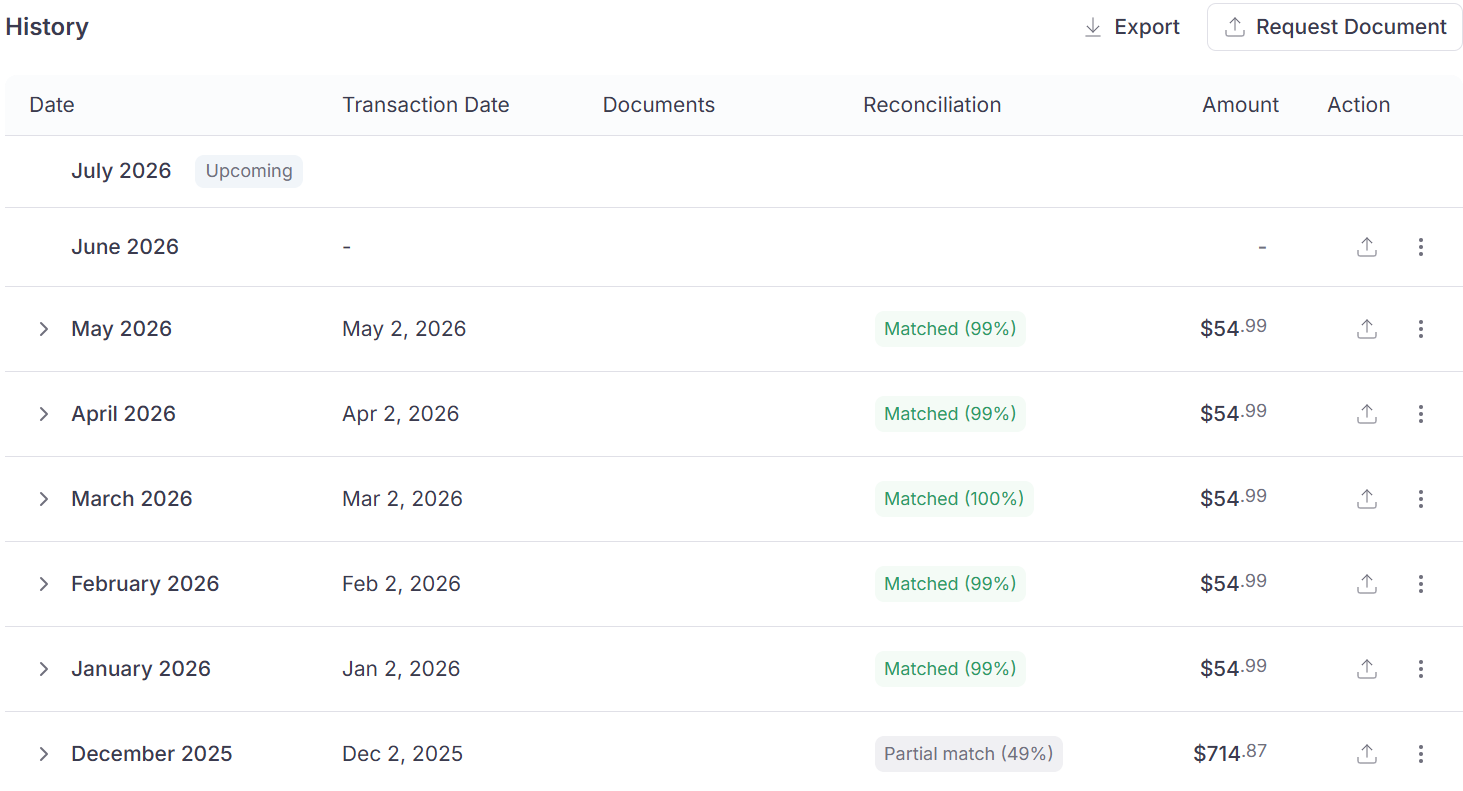
History
A per-month list of every charge, with columns:| Column | Description |
|---|---|
| Month | The billing period |
| Transaction date | The date the charge was processed |
| Amount | The amount charged |
| Documents | Invoices or receipts matched to this charge |
| Reconcile status | Whether the charge has been matched to a document |
| Action | Request a document, view matched files, etc. |
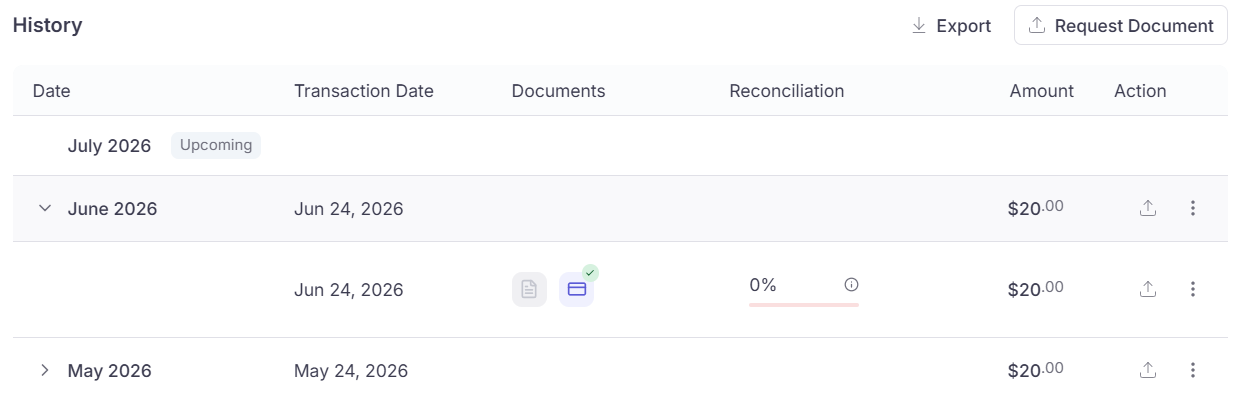
Reconcile status
| Status | Meaning |
|---|---|
| Matched (100%) | Every document for this period has been matched to a transaction |
| Pending | Documents are present but not yet fully reconciled |
Something wrong?
| Symptom | What to do |
|---|---|
| Reconcile stuck on Pending | Upload invoice for that month or request missing invoices |
| Duplicate charges | Duplicates and mark as transaction |
| Wrong category / missing from dashboard | Edit Category — SaaS vs Non-SaaS |
| Tags or aliases | Tags and aliases |